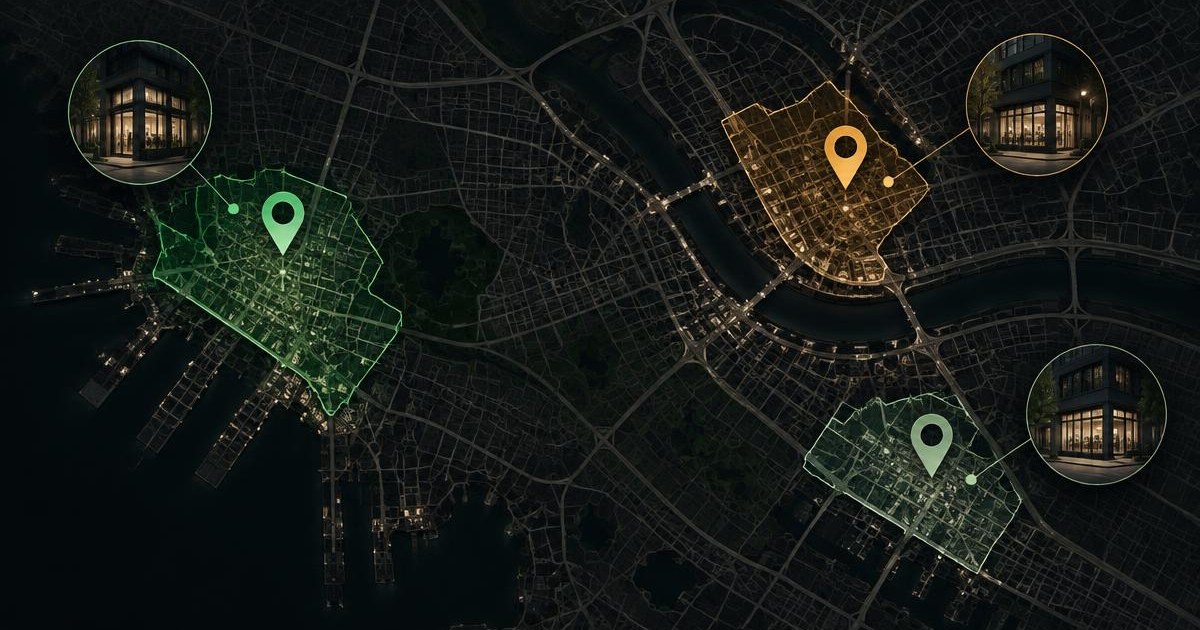
Best location for a Subway in Seoul
6 neighbourhoods ranked for restaurant sites on footfall, competition, rent and business-type fit.
Brand location map
Les meilleures zones pour ouvrir un Subway à Seoul
Compare neighbourhood fit for this business format. Published brand costs remain separate from local estimates.
Réponse directe
Dernière révision: 2026-09-01
Restaurant · Seoul — chiffres clés
- Investissement moyen
- €120,000 - €400,000
- Loyer commercial
- ₩80000-500000/sqm
- Indice de concurrence locale
- 63/100
- Seuil de rentabilité
- 20-42 mois
Source: WhereToOpen.ai location intelligence · 6 quartiers cartographiés · 2026-09-01. Ces valeurs sont des estimations de planification, non des données financières auditées.
Published Subway costs
Initial investment
$199,135–$536,745
Franchise / licence fee
$15,000
Verified break-even
Not publicly disclosed
Official · United States · verified 2026-09-22. Values below are a separate local model.
Source: Subway Franchise →Preuves et limites
Confiance: 87%- Données observées
- 6 mapped neighbourhoods, local competition, rent and location evidence.
- Données publiées
- Subway Franchise: Official cost information for United States.
- Données modélisées
- Brand Location Score, local ROI scenario and payback estimate. These are not brand disclosures or guarantees.
Non disponible: Subway has not publicly disclosed verified break-even timing.
Brand-specific score: 78% category/location evidence plus operating-format signals for footfall, catchment, transit, delivery and parking. Confidence reflects input completeness.
Opening investment
€120,000 - €400,000
WhereToOpen.ai estimate
Annual ROI
22-39%
WhereToOpen.ai estimate
Payback
16-38 months
WhereToOpen.ai estimate
Rent risk
Moderate
WhereToOpen.ai estimate
Top areas for a Subway in Seoul
- 1
Yeouido
Footfall fit, office catchment, transit access
Rent: ₩150,000-300,000
9888% confidence
- 2
Itaewon
Footfall fit, transit access, high footfall, strong fit for this business type, rising area
Rent: ₩100,000-200,000
9688% confidence
- 3
Gangnam
Footfall fit, office catchment, transit access
Rent: ₩200,000-400,000
8988% confidence
- 4
Hongdae
Footfall fit, high footfall, crowded market
Rent: ₩120,000-250,000
6488% confidence
- 5
Myeongdong
Footfall fit, transit access, high footfall, crowded market, weak fit for this business type
Rent: ₩250,000-500,000
5088% confidence
- 6
Seongsu
Transit access, weak fit for this business type, rising area
Rent: ₩80,000-160,000
5088% confidence
Brand-specific score: 78% category/location evidence plus operating-format signals for footfall, catchment, transit, delivery and parking. Confidence reflects input completeness. Last reviewed 2026-09-01. Model confidence: 87%. The local ROI and payback below are modelled estimates, not Subway disclosures or guarantees.
Subway in Seoul: frequently asked answers
Where is the best location for a Subway in Seoul?
Yeouido scores 98/100 for restaurant locations in Seoul, ahead of Itaewon (96/100) and Gangnam (89/100). Scores rank footfall, competition, rent and business-type fit across 6 mapped neighbourhoods.
Which areas of Seoul rank highest for a quick service restaurant?
Yeouido (98/100), Itaewon (96/100), Gangnam (89/100). Ranking last reviewed 2026-09-01 by WhereToOpen.ai.
How much does it cost to open a quick service restaurant in Seoul?
Subway's sourced investment is $199,135–$536,745 for United States. A local restaurant category benchmark runs €120,000 - €400,000, with commercial rent around ₩80000-500000/sqm. These figures have different scopes and are shown separately.
How long does a quick service restaurant in Seoul take to break even?
Subway does not publicly disclose a verified break-even period. The WhereToOpen.ai local scenario is 16-38 months, with modelled annual ROI of 22-39%. This is a model, not a brand claim or guarantee.
How competitive is Seoul for this category?
The local competition index is 63/100 averaged over 6 mapped neighbourhoods (higher means more crowded).
Which area of Seoul should a Subway franchisee avoid?
Seongsu scores lowest at 50/100 for this category: transit access, weak fit for this business type, rising area.
De la recherche à la décision
Vérifiez la zone exacte avant d’investir.
Comparez les quartiers sur la carte gratuite, puis débloquez le rapport complet pour obtenir des données à l’adresse.
La carte des opportunités est gratuite. Le rapport complet coûte 99 €.